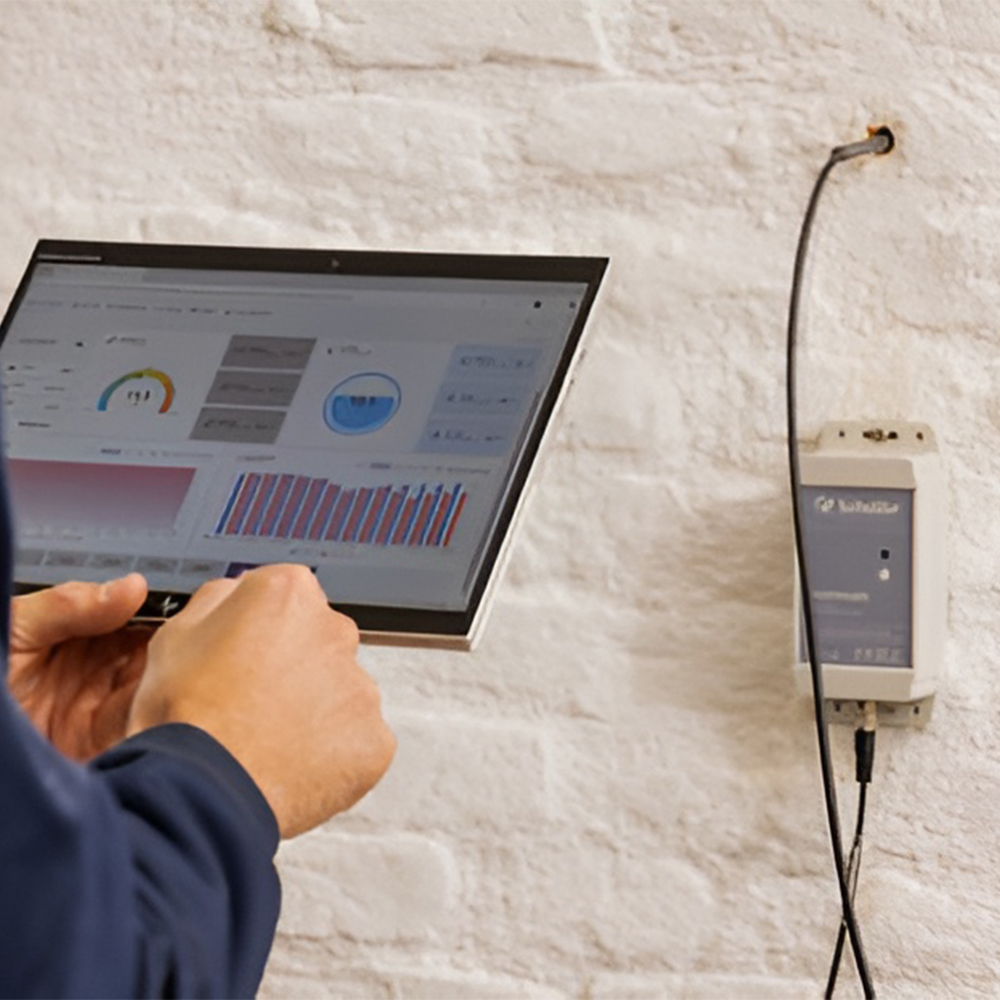
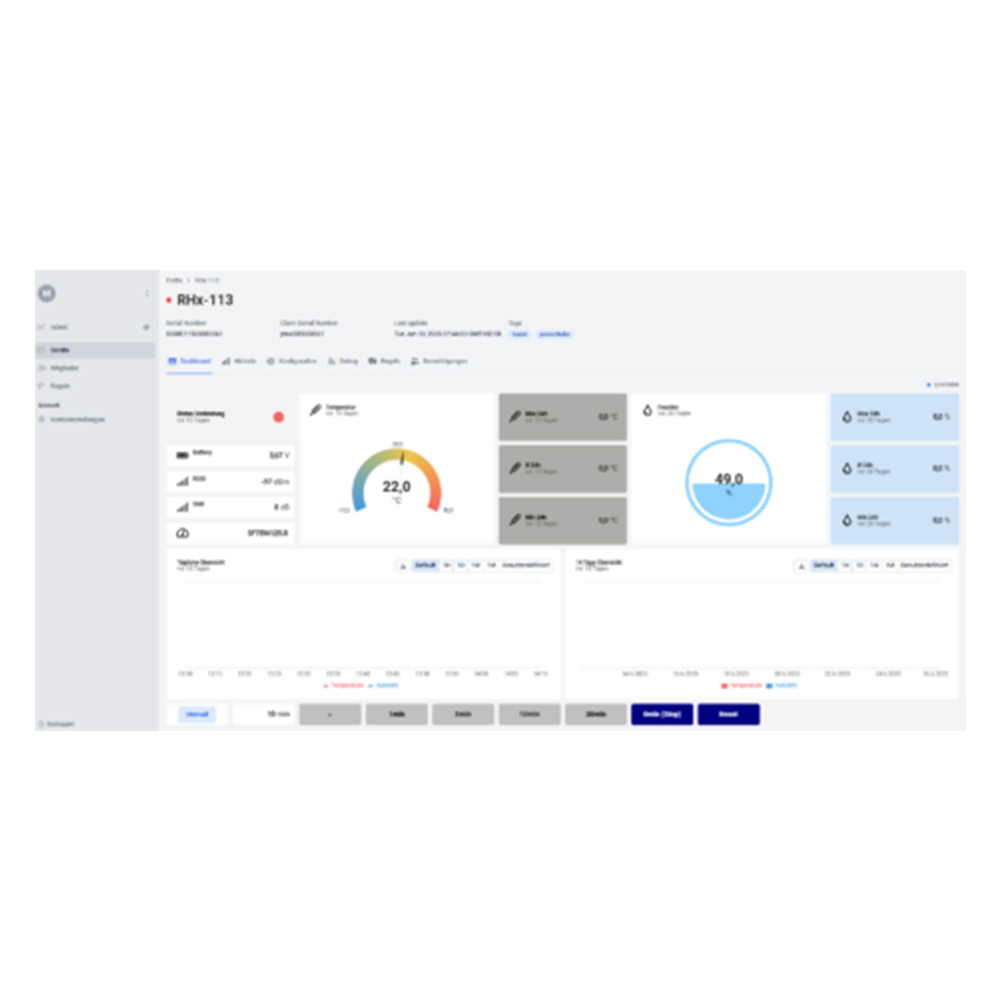
With the huminode The dashboard allows you to keep track of the measurement data collected by your sensors at all times.
Inquire nowReal-time data visualization
Flexible device organization through tags, folders and filters
Individually adjustable measurement intervals
Clear presentation of current, maximum, minimum and average values.
Web-based, secure and user-friendly interface
Benefits
Data at a glance
Real-time alarm functions when limit values are exceeded
Centralized data management for multiple locations
Web-based – access anytime and from anywhere
Automatic reporting for fast documentation
Description
huminode Dashboard – Data at a glance at all times.
The huminode dashboard clearly visualizes humidity, temperature, wood moisture content, water content, and other climate parameters in real time. Devices can be easily organized, filtered, and analyzed, allowing you to document precise climate data at any time.